This video will give you an overview of our Map Workspace within eSpatial.
In this how to video we will cover:
-
The functionality in your Control Panel such as:
-
Uploading your data
-
Styling
-
Analysis
-
-
Features in your Legend
-
Creating Optimized Routes
-
Your Data Table and how to filter your data
-
Exporting and Sharing
-
And how to manage your Map and data.
Control Panel:
To the left of our map workspace we have our control panel. In our control panel we can
- Add data, conduct various analyses, create optimized routes or style data to our specific preferences.

Add Data:
- To add data select the add data button and then select whether you would like to upload new data. This would be your CSV or excel files.
- Or add from library: which are eSpatial’s pre-existing datasets or datasets you have already uploaded or have been shared with you.


Styling:
You can enable styling by selecting the style button in your control panel:
From here your styling menu will open where you can navigate between your various datasets and style them according to your preferences:

- You can add and customize labels.
- Colour your pins based as a specific attribute such as status
- Styling your pins by size based on values such as sales value
- Style your pins by symbols by attribute such as industry
- Create a heat map based on point density or value of the data.

Analyze:
In your analyze menu you have the following options:

-
You can use a regional heatmap to summarize and colour your map by region. This can be used to trace performance in each of your territories.
-
Create radius or drive time buffers which allow you to find points in a specific distance or drive time, this can be used to view your sales, service or market coverage.
-
Create a nearest neighbor analysis which allows you to find the nearest points to locations such as your store or office locations, this can be used for resource allocation or target marketing.
-
A bubble map which allows you to summarize using scales values based on aggregated regional values
-
And Aggregate by value which allows you to summarize your record group by values

Legend:
To the right of our map workspace we have the Legend:
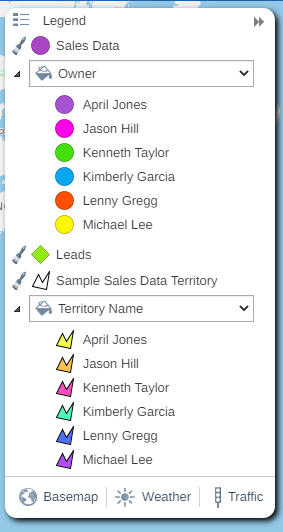
- In your legend you can see the various data sets you have added as well as the styling preferences you have selected.
- You can hide your datasets on your map by selecting the eye icon, in datasets styled by values, you can also hide selected values by turning the eye on and off one by one from here.
- The brush icon allows you to quickly turn on styling options such as colour by value and labelling for your datasets
- We have several base maps you can use to style your map you can toggle through these by selecting the base map button.
- We also have two weather overlays available radar showing weather conditions and satellite showing cloud cover.
- If you zoom into particular areas, you can turn on our traffic overlay to see current traffic conditions.
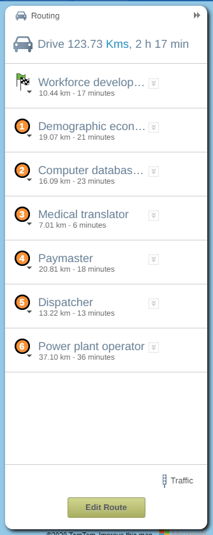
Routing:
To add routing to your map select the routing button in your control panel.
- You can use eSpatial routing to reduce travel costs, improve fuel efficiency and increase the number of customers and leads you serve.
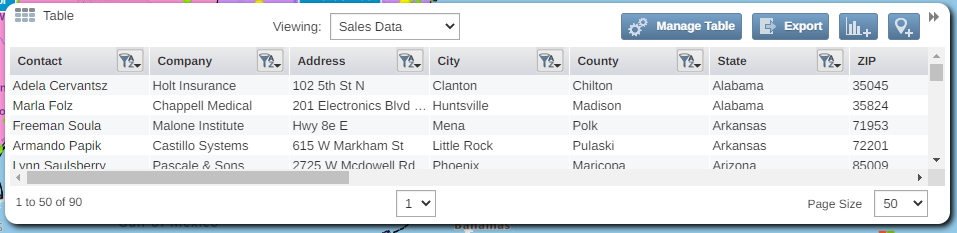
Data Table:
To the bottom right-hand corner of our workspace we have our data table:
- You can expand your table by selecting the double arrow icon
- You can then see the data added to your map in tabular format.
- You can toggle between datasets by selecting the viewing dropdown menu
Filtering:
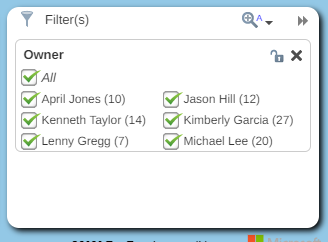
- You can use your table to filter your data to see particular records, you can do this by selecting the filter button next to the column you wish to filter by and selecting filter results.
- The filter window will then display where you can toggle on/off the data you wish to display
Exporting:
You can export your full dataset or filtered dataset as a CSV by selecting the export button.
Manage Table:
Manage table allows you to control what data is visible in the table such as removing columns from view.
Add Records
Users can add records to their dataset by selecting the add records button. A point will be added to the center of the screen where they can insert the relevant attribute and address information. eSpatial will then use the address information to accurately locate the point.
Editing Existing Points:
- You can edit an existing record by clicking on the point and then selecting the pen icon, from here you can edit any of your current data.
- If you edit any of the columns used to locate your point your point will automatically relocate to the newly entered address.
Address Search and Custom Areas:
- You can do an address lookup using our address search to the top of your screen.
- You can add a boundary using the custom areas tool to the right of your address search.
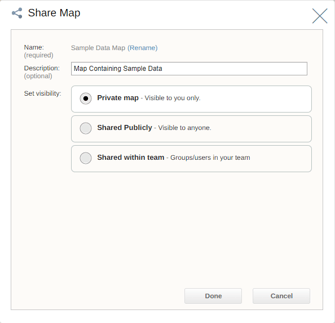
Exporting and Sharing:
Sharing:
The share button allows you to share your map as a public link or securely within your team.
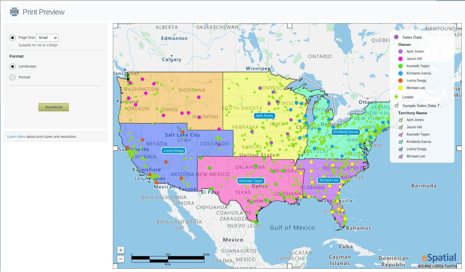
Print:
The print Icon allows you to export your map as a JPEG image.
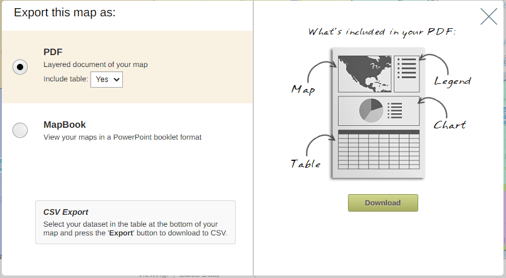
Export:
The export button allows you to export your map as a PDF or a PowerPoint presentation
Map Management:
Renaming your Map and Workspace:
- To rename your map or workspace hover over the current name until the pen icon appears.
- Click on the pen icon to then rename your map or workspace and update its general description.
Save:
- The save button allows you to save any changes made to your map, save a copy of your map or discard any changed made since the last save.
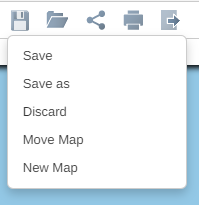
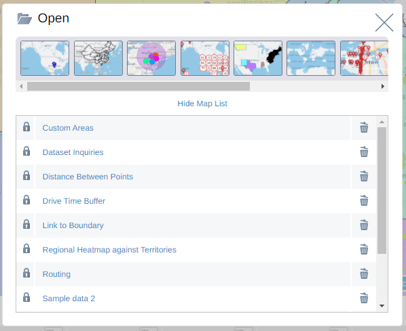
Open Map:
- The open map button allows you to navigate between the various maps in your workspace.
- This can also be done using the view maps button which gives you a thumbnail of each map in your workspace.
Finish
Thank you for watching our how-to video. If you have any questions you can contact us by emailing help@espatial.com or by selecting the chat button to the bottom left-hand corner of your screen when on our website or logged into eSpatial.