- To add Regional Heat Map analysis to your map select the analyze option in the control panel and the click on the Regional Heat Map button in the Analyze Data window.

- Select the Point dataset and Region Dataset you wish to use from the dropdown or select Add Dataset to add a region dataset from the eSpatial Datastore tab.
- If you would like to also see totals for pins that fall outside of your selected region dataset, select include outside results.
- Select complete and your Regional Heat Map will be created.

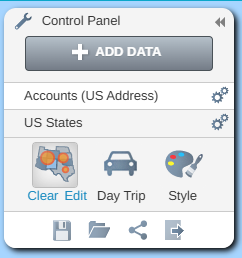
- Click on the Edit Analysis button on the Control Panel to edit the Heatmap.
- Click on the Clear Analysis button on the Control Panel to clear the Heatmap analysis.
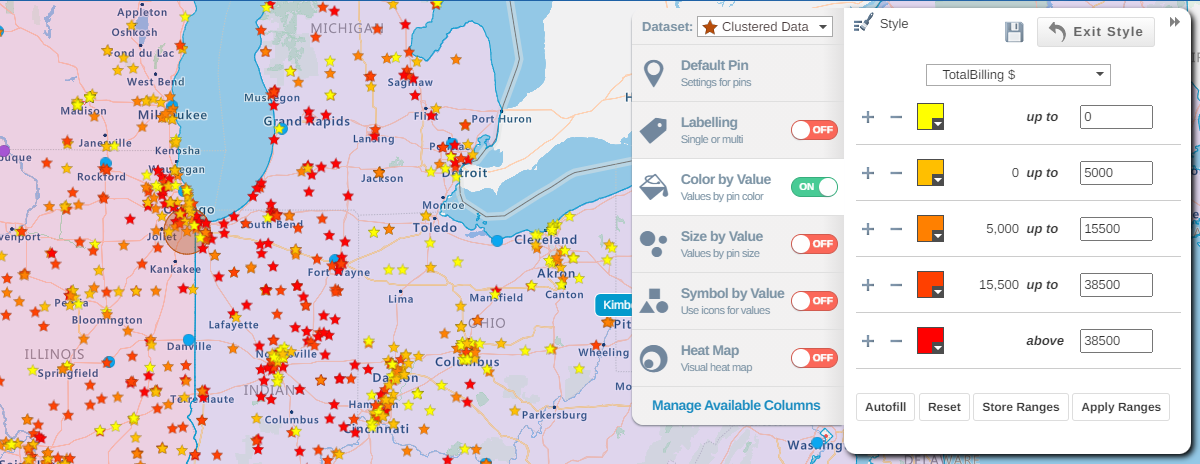
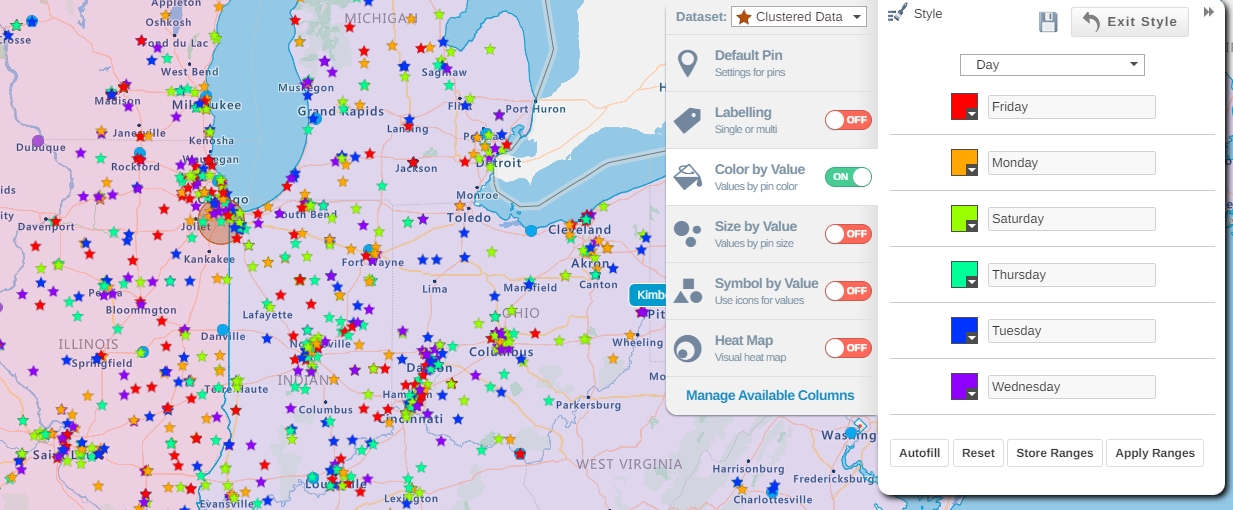
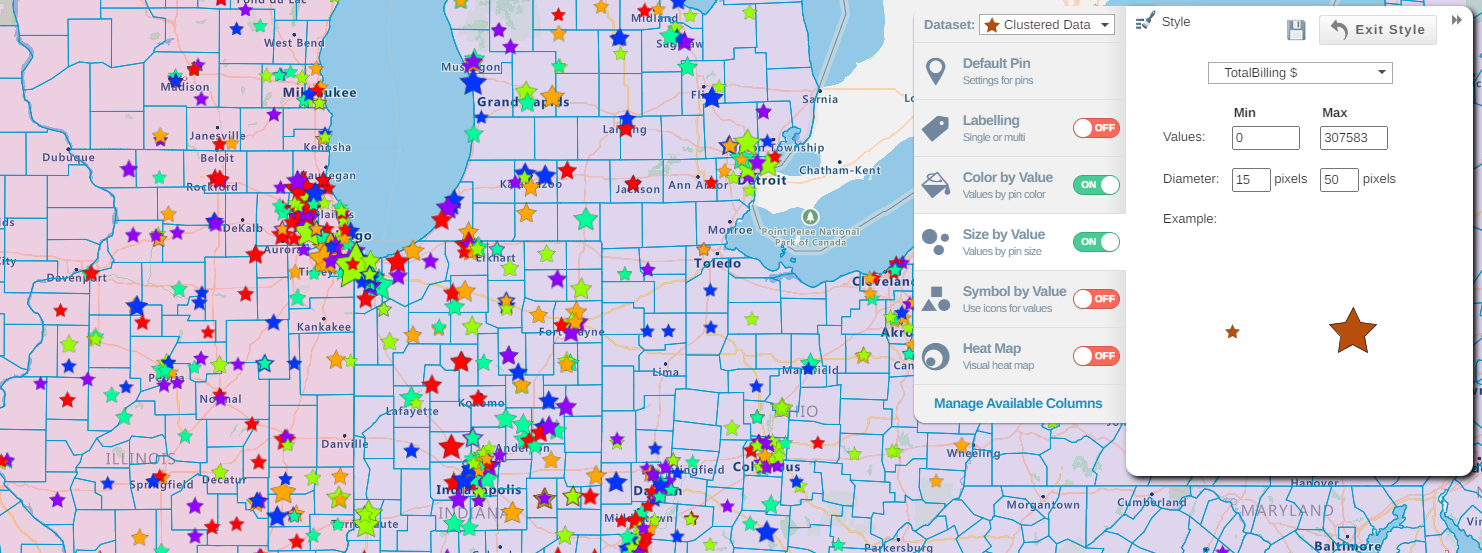
- You can change the styling of your Regional heatmap by going to the style menu and selecting your region dataset. For more information on how to do this, see our styling how to video.
Understanding your analysis data:
Region Dataset:
- When you expand the table you will see your values aggregated by your region.
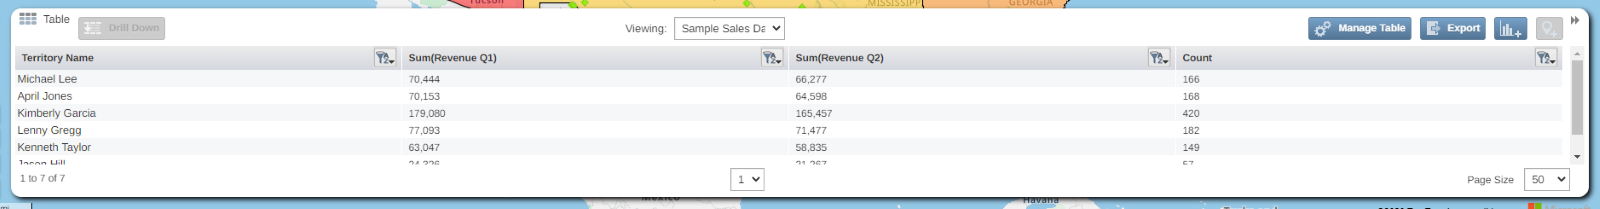
- If you chose to include outside results you will also see a category called outside that sums all the pin values that fall outside your regional dataset.
- You can include additional numerical columns to this table by selecting manage table.
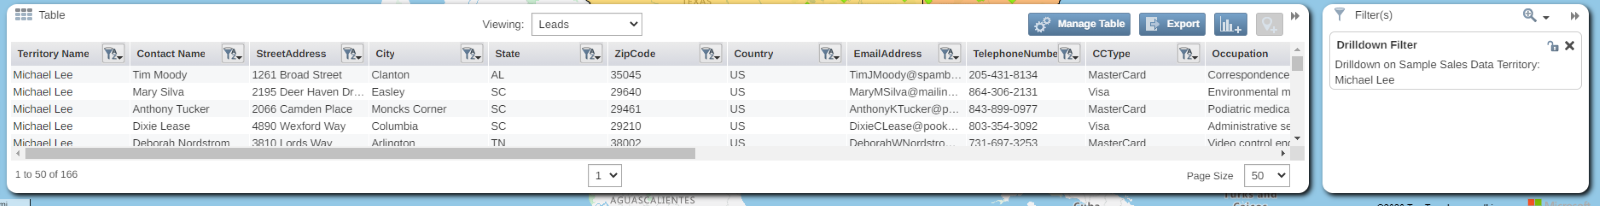
- To see a more detailed view of the pins that fall within a region click on the region in the table and select the drill down option.
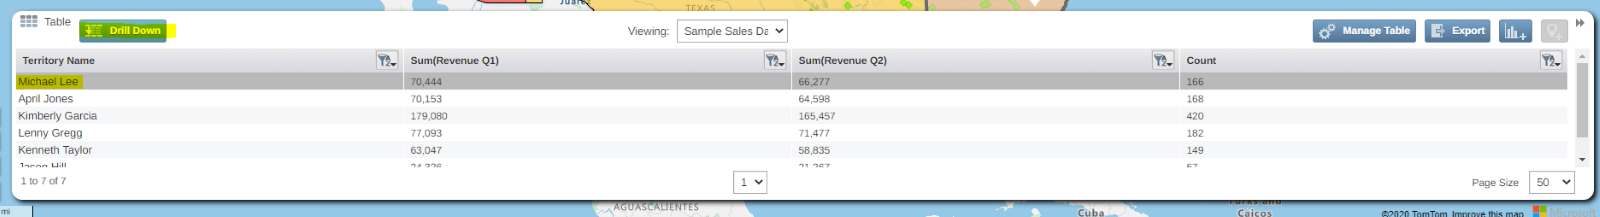
- This will navigate to the pin dataset in your table filtered to your selected region.
Pin Dataset:
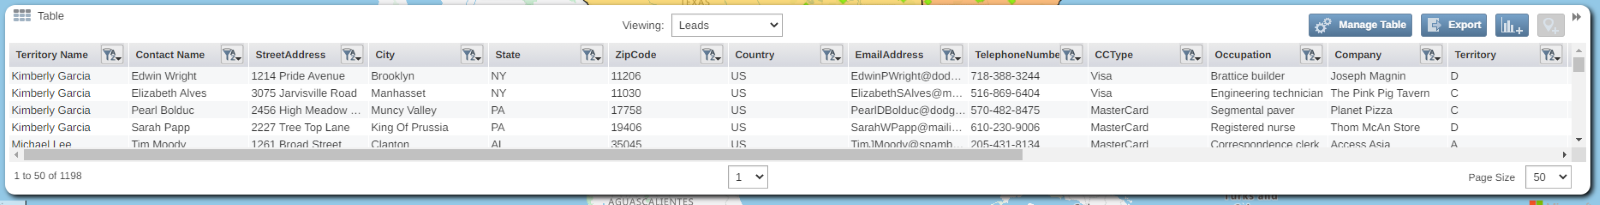
- Alternatively, you can also see all your pin data in your table by using the navigation bar. This data will display with an additional column stating which region the pin sits in.
- If you have included outside results the territory name will display as OUTSIDE for pins not located within your region dataset.
Saving your Regional Heat Map analysis:
- You can export the results of your Regional Heat Map as a CSV file by navigating to the relevant dataset in your table and selecting export. If you have included OUTSIDE results this can contain valuable information regarding which leads are outside your sales area.
- You can also save your aggregated results by region as a separate dataset by selecting the region dataset in your control panel and selecting save dataset to library.
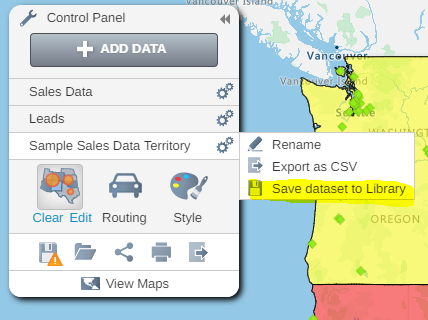
- You will then be prompted to give your new dataset a name and if you would like to add it to your map.
- Your analysis will then be saved as its own dataset giving you the option to run another analysis if desired. Please note that the analysis results for the saved dataset are for that point in time so if your edit your pin dataset or regions and redo your Regional Heat Map the saved dataset will still display the initial results.