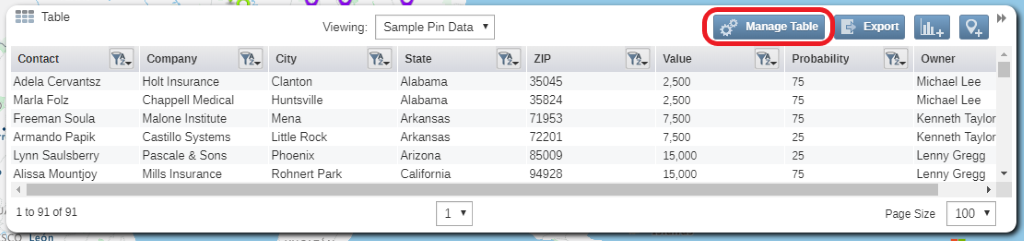
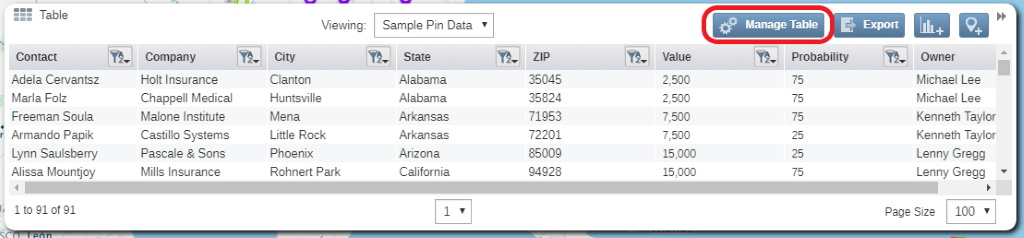
- Click on the Manage Table button at the top of the table to open the Manage Table window.
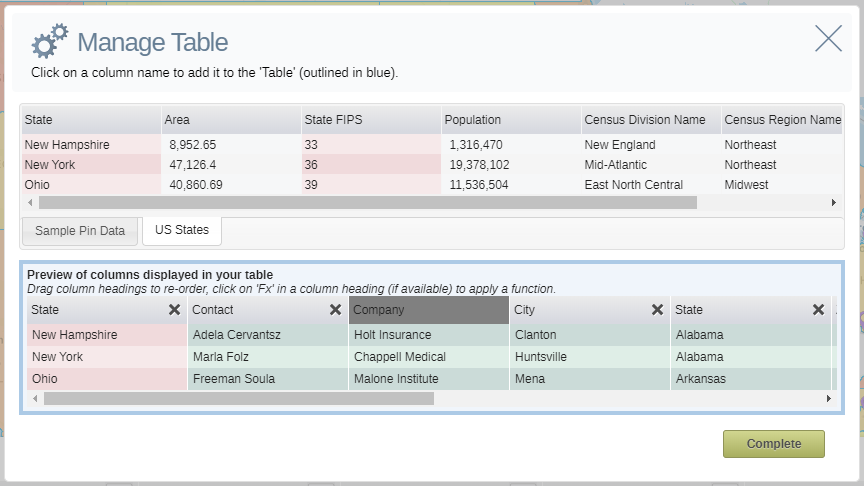
- Click on a column name in the top table to add it to the columns to be used in the Map Table. Columns that are available to be added will be highlighted in Pink. Columns that have already been added will be highlighted in green.
- Click on a column name in the bottom table to drag and re-order them.
- Hover over a column name in the bottom table and an X will appear in the top right corner of that column. Click on the X to remove the column.
- Click on the Complete button to close this window and return to the map.
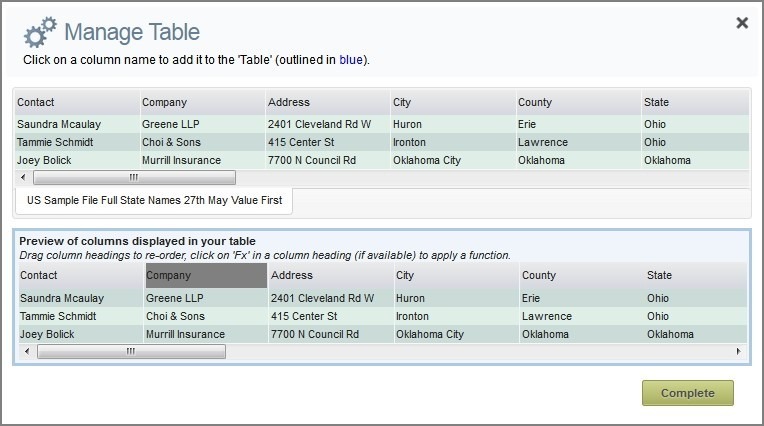
Manage Table where Analysis Present:
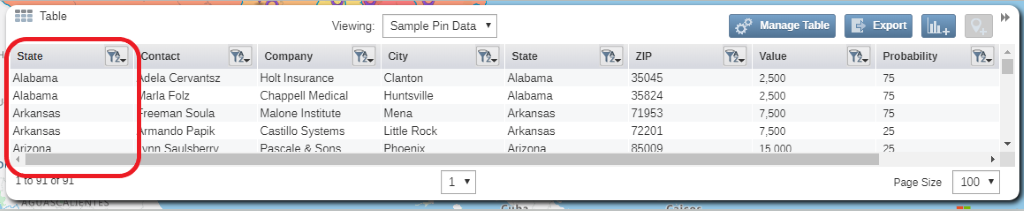
When an analysis such as regional heatmap is adding to the map, the data table for the pin dataset will automatically be updated to include the region area information.
Users can also add additional columns from their regional dataset to their pin dataset when an analysis is run by selecting the Manage Table function.
- Click on the region dataset tab to view the columns available to add to the pin dataset. Those in grey can be added to your pin dataset.
- Click on the grey columns to add them to your pin dataset.