Pin / Region Styling
How to customize the styling of your Pins and Regions (Polygons) in eSpatial
To enter the Style menu, click on the Style icon in the Control Panel.

By selecting the dropdown next to dataset you can edit which dataset you are styling. The symbol to the left will indicate if it is a point or regional (polygon) dataset.
Point Dataset

Regional Dataset

Pin Styling
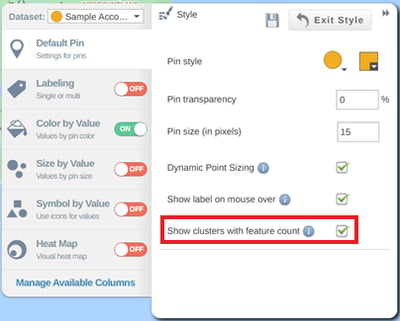
- Click on the Default Pin tab to change pin styling.
- Click on the Pin Style icon and select your chosen marker.
- Click on the Color Box to select your chosen color.
- Set the Pin Transparency level for the pin. Enter the value you want or use the slider bar to adjust the transparency.
- Use the Pin Size slider to change the size of the pin.
- Turn on the Dynamic Point sizing setting to adjust point sizes based on zoom level (Only available on circle point styling)
- Turn on the Show label on Mouse over setting to see a label when hovering over a data point.

Clustering
Turning Clustering on groups nearby points into clusters. These are displayed as circles with a number indicating the count of features in each cluster. This can help provide a clear overview of data density.
- Turn on the Show clusters with feature count to enable clustering.

- If you have Color by Value turned on, hovering over a cluster will give you a pie chart breakdown of the number of features in each cluster by color
- As you zoom in/out, the clusters will change to reflect this

Adding your own Pin Icons
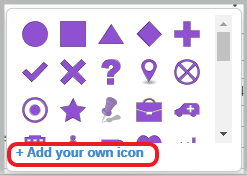
- Click on the Pin Style icon and select the Add your own icon link.
- Add the required image to the email and send to help@espatial.com
- We will upload the icon to your account and email you once its ready to use.
- Images to be used as icons must be either PNG, SVG or JPG. In order for an icon to be recolor-able based on values in your dataset it must be in SVG format.
- Images must be of equal height and width and the dimensions of each side must be in the range of 100-300 pixels.

Polygon Styling
- Click on the Default Polygon tab to change polygon styling.
- Set the border thickness from the drop down.
- Click on the Color Chooser and select your chosen color for the border.
- Click on the Color Chooser and select your chosen color for the fill.
- Set the Transparency level for the fill. Enter the value you want or use the slider bar to adjust the transparency.

Saving your Changes
- You can save your styling changes by selecting the save icon.
- To go back to your map select exit styling, if you haven’t saved your changes you will be asked if you want to apply changes made.
![]()
