You can add different types of analysis to your map from the Control Panel.
Analysis
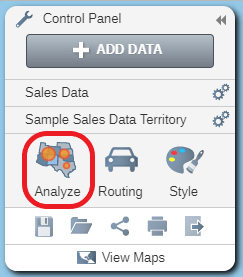
- Click on the Analyze Data button to open the Analyze Data window.
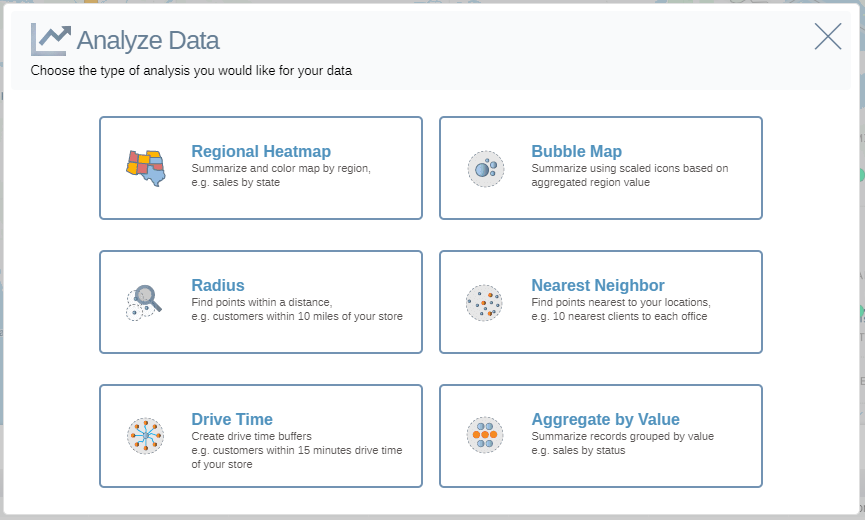
You can add six types of analysis to a map.
- Regional Heat Map – this will summarize values in a dataset by regions (e.g. total sales by State) and color the regions on the map based on the summarized data values.Initially this will be based on counts within each region. You can change the analysis to be based on numerical values in your data.
- Bubble Map – this will summarize values in a dataset by regions (e.g. total sales by State) and display scaled icons based on those summarized values. Initially this will be based on counts within each region. You can change the analysis to be based on numerical values in your data.
- Radius – this will create a radius search to find records in one dataset within a given distance of records in another dataset. (e.g. customers within 10 miles of your store)
- Drive Time - this will create a drive time buffer to find records in one dataset within a given drive time distance of records in another dataset. (e.g. customers within 30 minutes of your store).
- Nearest Neighbor – this will find a specified number of records in one dataset nearest to each other record in another dataset. (e.g. 10 nearest clients to each office).
- Aggregate by Value – This allows point datasets be aggregated by values in a column of that same dataset (e.g. Sum of Sales by Salesperson)