- Knowledge center
- Style
-
Getting Started
-
Video Resources
-
Data (Preparing/Adding/Editing)
-
Radius, Drivetime and Measurement Tool
-
Heat Mapping and Summary Analysis Tool
-
Territory Manager
-
Style
-
Data Table
-
Filtering Data
-
Routing
-
Saving, Exporting and Sharing Maps
-
Deleting
-
Managing / Organizing your Maps (Library)
-
Single Sign-On (SSO)
-
CRM & Data Integrations
-
eSpatial Mobile
-
For Salesforce
-
eSpatial Frequently Asked Questions
-
eSpatial Troubleshooting
Charts
Add a visual chart in seconds to enhance your map
You can easily add a Chart to your map. You can choose form the following chart types:
- Bar
- Line
- Pie
- Horizontal Bar
- Area
- Scatter
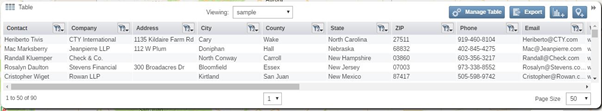
Add a Chart
- Click on the Add Chart button to open the Add Chart window.
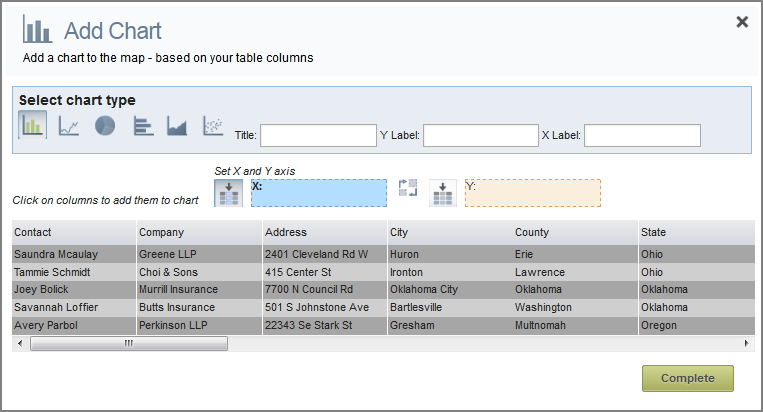
- Click on the Chart Type icons to select the type of chart you would like.
- Click on the column header you want for the X axis.
- Click on the column header you want for the Y axis. The column you choose for the Y axis must be an Integer column.
- Click on the Swap icon to swap the chosen values for the axis.
- Click on the Complete button to close this window and return to the map.
The Title and X and Y axis labels will be auto-completed based on your selections but you can overwrite these.
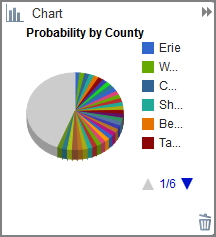
- Use the arrows to scroll through the values (if needed).
- Click on the Trashcan icon to remove the chart.